728x90
반응형
import numpy as np

# stack 은 쌓아 올리다. (연산이 아니다)
bream_length = [25.4, 26.3, 26.5, 29.0, 29.0, 29.7, 29.7, 30.0, 30.0, 30.7, 31.0, 31.0,
                31.5, 32.0, 32.0, 32.0, 33.0, 33.0, 33.5, 33.5, 34.0, 34.0, 34.5, 35.0,
                35.0, 35.0, 35.0, 36.0, 36.0, 37.0, 38.5, 38.5, 39.5, 41.0, 41.0]

# 도미의 무게
bream_weight = [242.0, 290.0, 340.0, 363.0, 430.0, 450.0, 500.0, 390.0, 450.0, 500.0, 475.0, 500.0,
                500.0, 340.0, 600.0, 600.0, 700.0, 700.0, 610.0, 650.0, 575.0, 685.0, 620.0, 680.0,
                700.0, 725.0, 720.0, 714.0, 850.0, 1000.0, 920.0, 955.0, 925.0, 975.0, 950.0]

# 빙어
smelt_length = [9.8, 10.5, 10.6, 11.0, 11.2, 11.3,
                11.8, 11.8, 12.0, 12.2, 12.4, 13.0, 14.3, 15.0]

smelt_weight = [6.7, 7.5, 7.0, 9.7, 9.8, 8.7,
                10.0, 9.9, 9.8, 12.2, 13.4, 12.2, 19.7, 19.9]

bream_length = np.array(bream_length)
bream_weight = np.array(bream_weight)

smelt_length = np.array(smelt_length)
smelt_weight = np.array(smelt_weight)
bream_data = np.column_stack((bream_length, bream_weight))
smelt_data = np.column_stack((smelt_length, smelt_weight))# shape
print(bream_data.shape)
print(smelt_data.shape)
import matplotlib.pyplot as plt

plt.scatter(bream_data[:,0], bream_data[:,1])
plt.scatter(smelt_data[:,0], smelt_data[:,1])
plt.xlabel("length")
plt.ylabel("weight")
plt.show()
# 한번에 표현
fish_data = np.vstack((bream_data[:3], smelt_data[:3]))
print(fish_data.shape)
print(fish_data)

fish_data_c = np.concatenate((bream_data[:3], smelt_data[:3]))
print(fish_data_c.shape)
print(fish_data_c)
fish_data = np.concatenate((bream_data, smelt_data))
#print(fish_data)
print(fish_data.shape)
plt.scatter(fish_data[:,0], fish_data[:,1])
plt.scatter(fish_data[:,0], fish_data[:,1])
plt.xlabel("length")
plt.ylabel("weight")
plt.show()
# print(fish_data.shape) # 전체 0~48 (크기 = 49개)
# print(fish_data[0:35])
# print(fish_data[35:])

# fish_data (0~34 도미 = 35개, 35~49 빙어 = 14개)

# fish_target = [1.1.1.1.1 ~ 35개, 0.0.0.0.0. ~ 14개 ]
fish_target = np.concatenate((np.ones(35), np.zeros(14)))
print(fish_data.shape)
print(fish_target.shape)
fish_data + fish_target → 합치기 위해 fish_target의 shape를 (49,1)로 만든다
fish_target = fish_target.reshape((-1,1))

fishes = np.hstack((fish_data,fish_target))
print(fishes)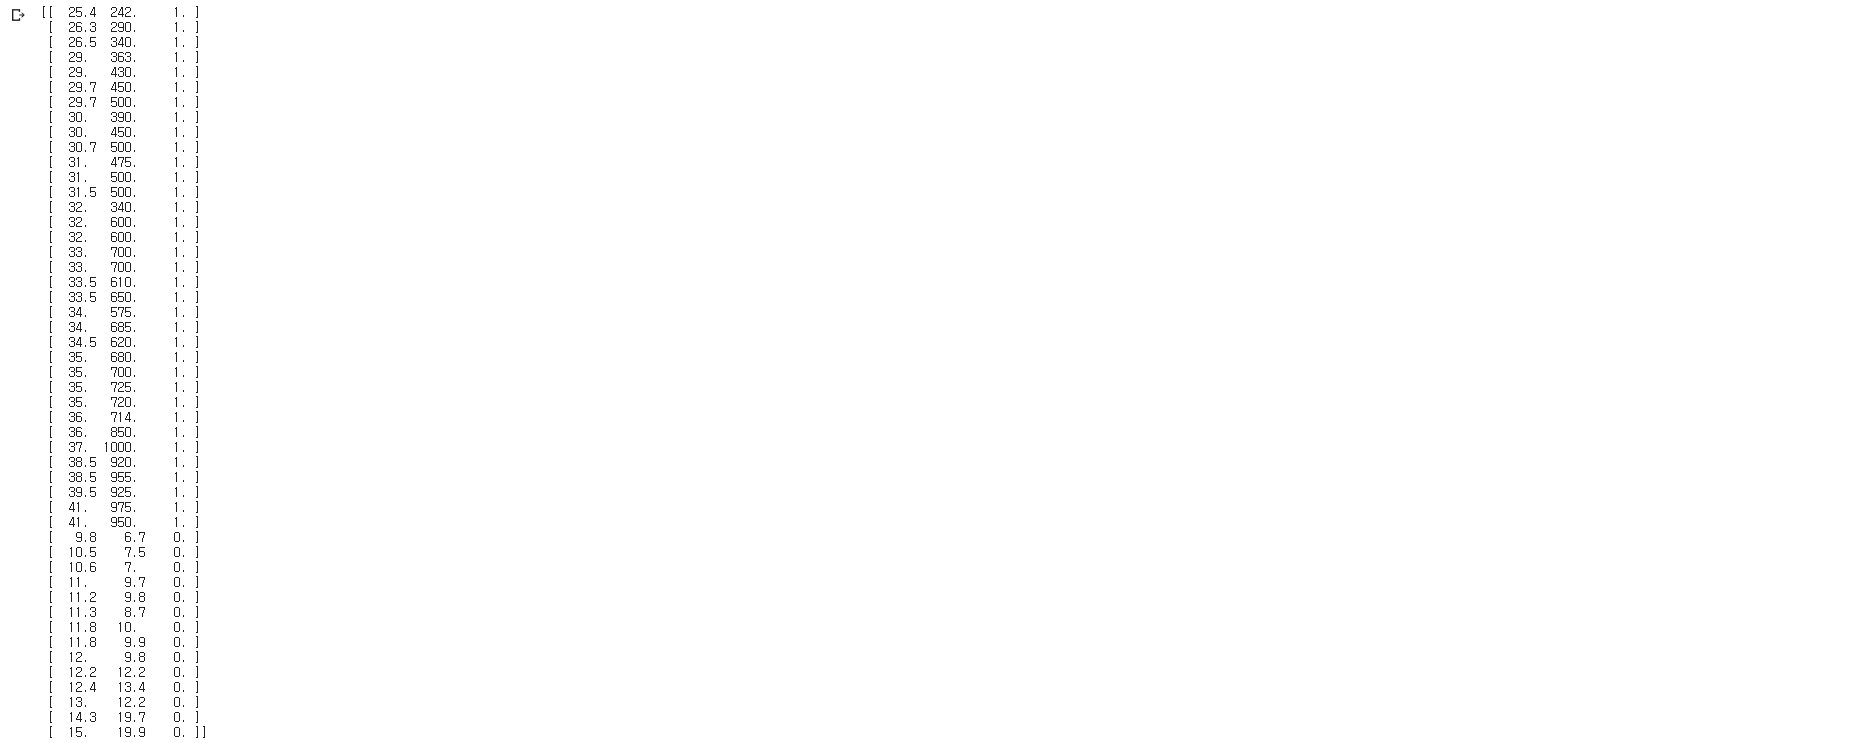
Pandas
pandas에서는 vector를 Series, 2차원 matrix(Entity, table) → DataFrame라 한다.
import pandas as pd
from pandas import Series, DataFrame
# pip install pandas

s1 = Series(data=[1,2,3,4])
print(s1)
print(type(s1))
dic1 = [
    {25.7, 200, 1},
    {30.1, 300, 1},
    {13.5, 8, 0}
]

df1 = pd.DataFrame(dic1)
print(df1)
dic2 = [
    {"len": 25.7, "wei": 200, "target": 1},
    {"len": 30.1, "wei": 300, "target": 1},
    {"len": 13.5, "wei": 8, "target": 0}
]

print(type(dic2))
df2 = pd.DataFrame(dic2)
print(df2)
print(type(df2))
728x90
반응형
'Programming > Python' 카테고리의 다른 글
| Python Numpy 6강 - BroadCasting (0) | 2021.10.20 |
|---|---|
| Python Numpy 5강 - DB연결, 학습 (0) | 2021.10.20 |
| Python Numpy 3강 - arange, zeros, ones (0) | 2021.10.20 |
| Python Numpy 2강 - Slicing (0) | 2021.10.20 |
| Python Numpy 1강 - 배열 (0) | 2021.10.20 |