# 판다스 = 행렬 데이터(Matrix = 2차원) = 테이블
# 데이터(2차원)를 다루는 파이썬 라이브러리

import pandas as pd
import numpy as np
import matplotlib.pyplot as plt
pandas.Series — pandas 1.3.4 documentation
Values must be hashable and have the same length as data. Non-unique index values are allowed. Will default to RangeIndex (0, 1, 2, …, n) if not provided. If data is dict-like and index is None, then the keys in the data are used as the index. If the ind
pandas.pydata.org
# 시리즈

s1 = pd.Series([1,3,5,np.nan,6,8], dtype=float) # Vector
s1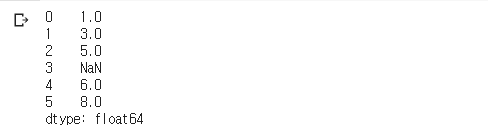
date1 = pd.date_range("20211021",periods=6)
print(date1)

s2 = pd.Series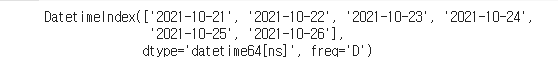
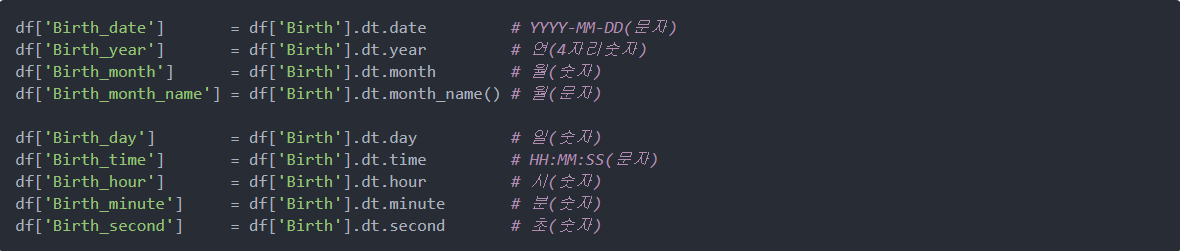
datatime64 타입으로 변환했을 시 매우 간단하게 연,월,일,시,분,초 등의 시간 속성을 쉽게 얻을 수 있다.
pandas.DataFrame — pandas 1.3.4 documentation
Column labels to use for resulting frame when data does not have them, defaulting to RangeIndex(0, 1, 2, …, n). If data contains column labels, will perform column selection instead.
pandas.pydata.org
# datetime64 일자와 시간을 표기하는 타입을 지원
# 문자열로 되어있는 일자 (연월일)나 시간(시분초)를 to_datetime이라는 함수로
# datetime64 타입으로 변환할수 있다.

# 2021/10/21, 2021-10-21, 20211021, 2021;10;21
date2 = pd.date_range("20211021",periods=6)
df1 = pd.DataFrame(data=date2, index=[1,2,3,4,5,6], columns=["날짜"])
print(date2)
print(df1)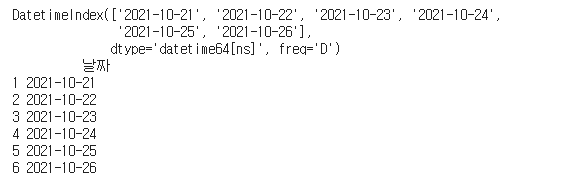
python random모듈 3개 정리 (randint, rand, randn)
블로그정리 1. np.random모듈 numpy 의 np.random. randint vs rand/randn ¶ np.random.seed seed를 통한 난수 생성 np.random.randint 균일 분포의 정수 난수 1개 생성 np.random.rand 0부터 1..
nittaku.tistory.com
date3 = pd.date_range("20211021",periods=6)
df3 = pd.DataFrame(np.random.randn(6,4),index=date3)
print(df3)
list4 = [
    {"id":1, "username":"ssar"},
    {"id":2, "username":"cos"},
    {"id":3, "username":"love"}
]
dict4 = {
    "A":1,
    "B":pd.Timestamp("20211022"),
    "C":pd.Series([1,2,3,4,5,7,8,9,10]),
    "D":"A"
}

df4_1 = pd.DataFrame(list4)
df4_2 = pd.DataFrame(dict4, index=[0,1,2,3,4,5,6,7,8,9])
print(df4_1)
print("="*50)
print(df4_2)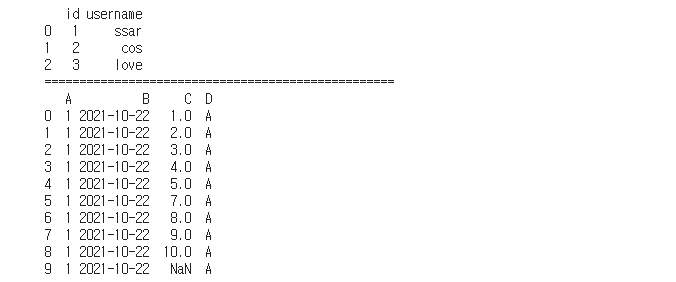
print(df4_2.dtypes)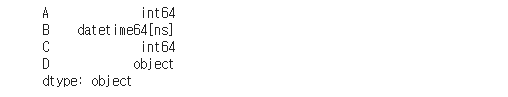
# DataFrame 함수 알아보기
print(df4_2.head()) # 5개만 보기
print("="*50)

# 자유도가 너무 높아서 행, 열로 볼 수 있음. 다른 함수를 이용할 예정!!
print(df4_2[0:5]) # slicing 연산자
print("="*50)
print(df4_2["A"])

print("="*50)
print(df4_2.tail(3)) # 뒤에서 n개 보기, default=5
print(df4_2.describe()) # 전체적인 통계구조
print("="*50)
print(df4_2)
print("="*50)
print(df4_2.T) # Pivot
df4_2.values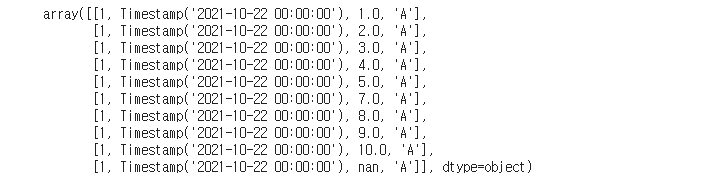
df4_2.columns
'Programming > Python' 카테고리의 다른 글
| Python pandas 3강 - Nan 제거 (0) | 2021.10.26 |
|---|---|
| Python pandas 2강 - DataFrame 사용 (0) | 2021.10.26 |
| Python Numpy 7강 - 행렬곱, 연립방정식 (2) | 2021.10.21 |
| Python Numpy 6강 - BroadCasting (0) | 2021.10.20 |
| Python Numpy 5강 - DB연결, 학습 (0) | 2021.10.20 |